GOES-R Series News | 2025
-
February 6, 2025: Earth from Orbit: NOAA Satellites Track Powerful Atmospheric Rivers Impacting the West Coast

Since Jan. 31, 2025, NOAA satellites have been closely monitoring a series of strong atmospheric rivers bringing heavy rain and mountain snow from central California to the Pacific Northwest, the Sierras, southern Cascades, and northern Rocky mountains. GOES-18 (GOES West) provides detailed information about moisture in the atmosphere and allows forecasters to track atmospheric rivers as they happen. The satellite provides critical data about the movement of clouds and water vapor patterns that help to forecast heavy rain and flash flooding from atmospheric rivers. As atmospheric rivers continue to impact the western U.S., NOAA satellites will closely monitor these events and provide critical information to forecasters and local communities.
February
-
January 21, 2025: GOES-R/GeoXO Newsletter, October – December 2024

The GEO team gathered in October 2024 to celebrate building and launching all four satellites in the GOES-R Series. The GOES-R/GeoXO quarterly newsletter for October – December 2024 is now available. As GOES-19 prepares to enter operational service, the team is recognized for the tremendous amount of hard work and dedication they have put into GOES-R since 1999. From the very start of the program, the GOES-R team has been recognized as setting the standard for satellite and ground system development as well as inter-agency collaboration. The GOES-R system will continue to serve our nation providing observations of severe weather and environmental conditions into the 2030s, while the focus of our team now turns to GeoXO development. We completed the Mission Definition Review in December, are working on evolving the ground system for GeoXO, and are preparing to enter the preliminary design phase. Congressional support of GeoXO has us on track for planned launches. It is an exciting time as we make NOAA’s next-generation geostationary satellite system a reality, bringing new and improved capabilities to meet our users’ needs and address emerging environmental challenges.
-
January 21, 2025: Earth from Orbit: NOAA Satellites Track Raging Wildfires in California
NOAA satellites are closely monitoring wildfires burning in the Los Angeles metropolitan area. The first blazes erupted on Jan. 7, 2025, and quickly exploded in size and intensity, prompting widespread evacuation orders. The destructive wildfires have destroyed thousands of structures and claimed the lives of at least 25 people according to reporting by local authorities. GOES-18 (GOES West) monitored the fires in near real-time, measured the intensity, tracked the spread and movement of smoke.
-
January 14, 2025: NOAA Celebrates 50 Years of GOES Satellites
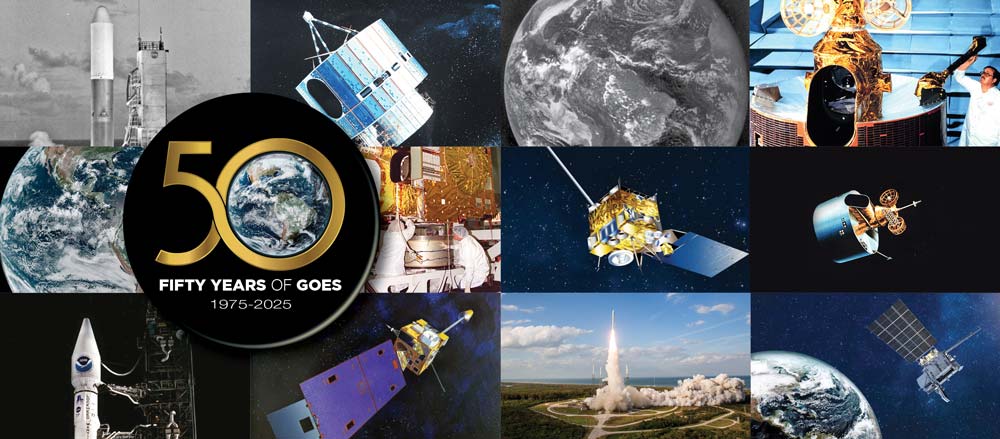
In 2025, NOAA is celebrating 50 years of its heralded Geostationary Operational Environmental Satellite program, known as GOES. For five decades, NOAA and NASA have partnered to advance NOAA satellite observations from geostationary orbit. GOES are our sentinels in the sky: keeping constant watch for severe weather and environmental hazards on Earth and dangerous space weather. As NOAA celebrates the long legacy of the GOES, we continue to rely on these satellites for short-term forecasts of hazardous weather, detection and monitoring of environmental phenomena like wildfires, smoke, volcanic ash, dust storms and fog, and warnings of approaching space weather that can disrupt communication and navigation systems, disrupt power grids, damage satellites in space and expose astronauts to harmful radiation.